The probability paradox: Risk assessment and machine safety
July 27, 2012
By Douglas Nix
In Occupational Health and Safety (OHS), risk is a function of severity of injury and the probability of the injury occurring. Understanding the severity portion is usually fairly easy, although advanced technologies, like lasers for instance, take advanced hazard analysis methods to assess correctly.
Probability, on the other hand, is a challenge. Mathematically, probability calcuAlations go from sublimely simple to insanely complex. The simplest forms, like the probability of getting a number from 1 to 6 when you throw a single die, can be understood pretty easily. On any one throw of the die, you have a 1 in 6 chance of getting any one particular number, assuming the die is not weighted in any way. When we’re talking about OHS risk, it’s never that easy.
The first problem: No data
Risk assessment can be done quantitatively, that is, using numeric data. This approach is often taken when numeric data is available, or where reasonable numeric estimates can be made. The problem with using numeric estimates in quantitative assessments, is this: math lends credibility to the answer for most people. Consider these two statements:
1. After analyzing the available information, we believe that the risk is pretty low, because it is unlikely that the reactor will melt down.
2. After analyzing the available information, we believe that the risk of a fatality in the surrounding population is very low, because the probability that the reactor will melt down is less than one in 1 million.
Which of these statements sounds more ‘correct’ or more ‘authoritative’ to you?
Attaching numbers to the statement makes it sound more authoritative, even if there is no reliable data to back it up! If you are going to attempt to use quantitative estimates in a risk assessment, be sure you can back the estimates up with verifiable data. Frequently there is no numeric data, and that forces you to move from a quantitative approach to semi-quantitative approach, meaning that numbers are assigned to estimates, usually on a scale, like 1–5 or 1–10 representing least likely to most likely, or a fully qualitative approach, meaning that the scales are only descriptive, like ‘unlikely, likely, very likely.’ These kinds of assessments are much easier to make as long as the scales used are well designed, with clear descriptions for each increment in the scale, because the data used in the assessment is the opinion of the assessors.
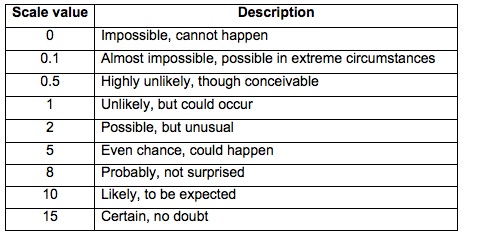
Here’s an example, taken from Chris Steel’s 1990 article [1]:
Table 1: LO Likelihood of occurrence
 {nomultithumb}
Some people might say that this scale is too complex, or that the descriptions are not clear enough. I know that the subtleties sometimes get lost in translation, as I discovered when trying to train a group of non-native-English-speaking engineers in the use of the scale. Linguistic challenges can be a major hurdle to overcome! Simpler scales, like that used in CSA Z432 [2], can be easier to use, but may result in gaps that are not easily dealt with. For example:
Table 2: Avoidance
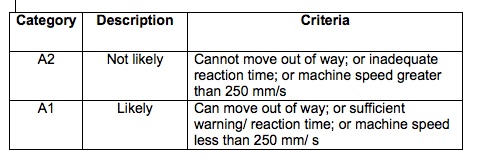
A scale like the previous one may not be specific enough, or fine enough (sometimes referred to as ‘granularity,’ or in this case ‘granular enough’) too be really useful. There are software packages for risk assessment available as well. One popular product called CIRSMA uses a scale that looks like this:
Table 3: Probability of the hazardous event
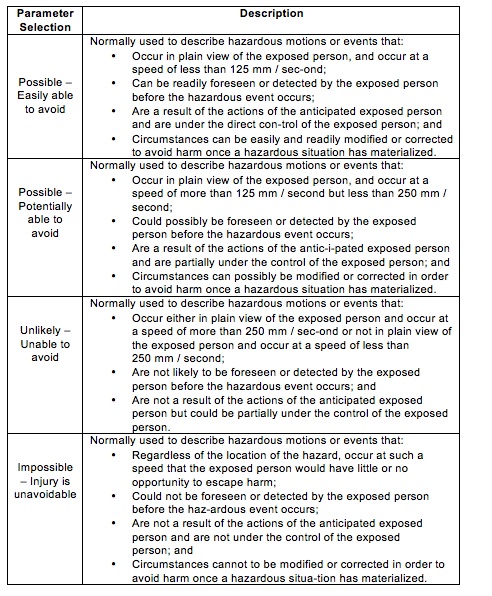
A scale like this is more descriptive than the CSA scale, but less granular and a bit easier to use than the Steel table.
Probability is also influenced by frequency of exposure to the hazard, and each of the tools mentioned above have scales for this parameter as well. I’m not going to spend any time on those scales here, but know that they are similar to the ones displayed in terms of granularity and clarity.
The second problem: Perception
This is the really big problem, and it’s one that even the greatest minds in risk assessment and communication have yet to solve effectively. People judge risk in all sorts of ways, and the human mind has an outstanding ability to mislead us in this area. In a recent article published in the June 2012 issue of Manufacturing AUTOMATION magazine, Dick Morley talks about the ‘Monty Hall problem’ [3]. In this article, Morley quotes columnist Marilyn vos Savant from her ‘Ask Marilyn’ column in Parade Magazine:
“Suppose you’re on a game show and you are given the choice of three doors. Behind one door is a car, behind the others, goats. You pick a door, say, number one (but the door is not opened). And the host, who knows what’s behind the doors, opens another door, say, number three, which has a goat. He says to you, ‘Do you want to pick door number two?’ Is it to your advantage to switch your choice?”
Here is where things start to go astray. If you keep your original choice, your chance of winning the car is 1:3, since the car could be behind any of the three doors. If you change your mind, your chances of winning the car become 2:3, since you know what is behind one door, and could theoretically choose that one, or choose one of the other two. Since you know for certain that a goat is behind door three, that choice is guaranteed. Choose Door Three and get a goat. But if you choose to change your decision, your chances go from 33 per cent to 66 per cent in one move, yet most people get this wrong. Mathematically it’s easy to see, but humans tend to get emotionally distracted at times like this, and make the wrong choice. According to Morley, studies show that pigeons are actually better at this than humans!
When we start to talk about risk in abstract numbers, like ‘one fatality per year per 1 million population’ or stated another way, ‘1 x 10⁻⁶ fatalities per year’ [4], people lose track of what this could mean. We like to talk to ourselves with a time frame attached to these things, so we might tell ourselves that, since it’s June now and no one has died, that somehow the risk is actually half of what was stated, since half the year is gone. In fact, the risk is exactly the same today as it was on Jan. 1, assuming nothing else has changed.
In a recent court case involving a workplace fatality, one expert witness developed a theory of the risk of the fatality using the Human Factors approach commonly used in the process and nuclear industries. Using estimates that had no supporting data, he came to the conclusion that the likelihood of a fatality on this particular machine was 1 x 10⁻⁸, or roughly two orders of magnitude less than being hit by lightning. In OHS, we believe that if a hazard exists, it will eventually do harm to someone, as it did in this case. We know without a doubt that a fatality has occurred. The manufacturer’s sales department estimated that there were 80–90 units of the same type in the marketplace at the time of the fatality. If we use that estimate of the number of that model of machine in the marketplace, we could calculate that the risk of a fatality on that model as 1:80 or 1:90 (8 x 10⁻¹ or 9 x 10⁻¹), significantly greater than the risk of being struck by lightning, and more than seven orders of magnitude more than estimated by the expert witness. Estimating risk based on unproven data will result in underestimation of the risk and overconfidence in the safety of the workers involved.
Communication
Once a risk assessment is completed and the appropriate risk controls implemented following the Hierarchy of Controls, the residual risk must be communicated to the people who are exposed to the risk. This allows them to make an informed decision about the risk, choosing to do the task, modify the task or not do the task at all. This is called ‘informed consent,’ and is exactly the same as that used by doctors when discussing treatment options with patients. If the risk changes for some reason, the change also needs to be communicated. Communication about risk helps us to resist complacency about the risks that we deal with every day, and helps to avoid confusion about what the risk ‘really is.’
Risk perception
Risk perception is an area of study that is trying to help us to better understand how various kinds of risks are perceived, and perhaps how best to communicate these risks to the people who are exposed. In a report prepared at the UK’s Health and Safety Laboratory in 2005 [5], authors Williams and Weyman discuss several ways of assessing risk perception.
One approach, described by Renn [6], attempts to chart four different aspects of risk perception in people’s thinking.
Figure 1: Risk perception factors
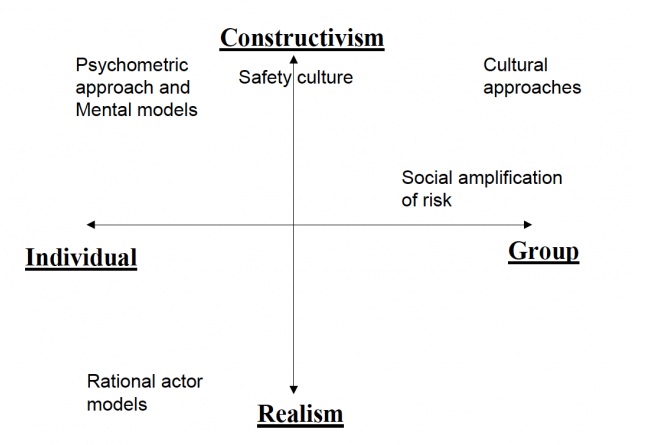
An example of these factors plotted on a graph is shown in Figure 2 below. The data points plotted on the chart are developed by surveying the exposed population and then charting the frequency of their responses to the questions.
Figure 2: Graphing ‘dread’
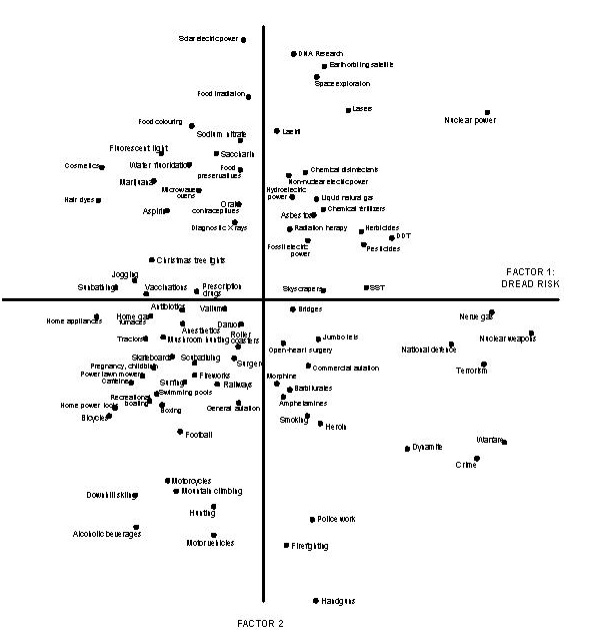
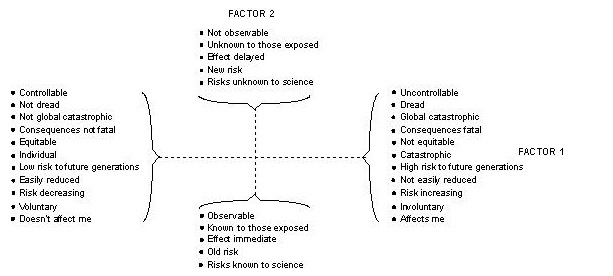
There are two factors charted on this graph. On the vertical axis, ‘Factor 2′ is the perceptability of the risk, or how easily detected the risk is. On the horizontal axis is ‘Factor 1 — The Dread Risk,’ or how much ‘dread’ we have of certain outcomes. In Figure 3 below you can see the assignment of factors to the positive and negative directions on these axes.
Figure 3: Dread factors
At this point, I can say that we are a long way from being able to use this approach effectively when considering machinery safety, but as practitioners, we need to being to consider these approaches when we communicate risk to our customers, users and workers.
When you are thinking about risk, it’s important to be clear about the basis for the risk you are considering. Make sure that you are using valid, verifiable data, especially if you are calculating a numeric value to represent the probability of risk. Where numeric data isn’t available, use the semi-quantitative and qualitative scoring tools that are available to simplify the process and enable you to develop sound evaluations of the risk involved.
References
[1] C. Steel. “Risk estimation.” The Safety and Health Practitioner, pp. 20–22, June, 1990.
[2] Safeguarding of Machinery, CSA Standard Z432- 1994 (R1999).
[3] R. Morley. “Analyzing Risk: The Monty Hall problem.” Manufacturing AUOTMATION, June, 2012. p.26.
[4] J. D. Rimington and S. A. Harbison, “The Tolerability of Risk from Nuclear Power Stations,” Health and Safety Executive, Her Majesty’s Stationary Office, London, UK, 1992.
[5] J. Williamson and A. Weyman, “Review of the Public Perception of Risk, and Stakeholder Engagement”, The Crown, London, UK. Rep. HSL/2005/16, 2005.
[6] O. Renn, “The Role of Risk Perception for Risk Management.” in P.E.T. Douben (ed.): Pollution Risk Assessment and Management. Chichester et. al (John Wiley & Sons 1998), pp. 429–450
Douglas Nix, A.Sc.T., is managing director at Compliance InSight Consulting, Inc. (www.complianceinsight.ca) in Kitchener, Ont. He produces a blog and podcast called Machinery Safety 101, exploring a wide variety of machine safety topics. Check out his blog at www.machinerysafety101.com.