Measuring quality: How to use manufacturing intelligence to address quality bottlenecks
June 14, 2007
By Nathan Sheaff
The continuous struggle to deliver top quality products while balancing optimal throughput is driving manufacturers to seek more intelligent tools to help manage their processes.
The effects of quality bottlenecks can be felt across the entire line and affect a plant’s profitability. Additionally, as the manufacturing world is transitioning through the paradigm shift of the lean manufacturing concept, based in large part on the Toyota production system, it has increased the impact of bottlenecks on the production line.
As accountability in the plant increases, quality professionals need to have more insight into the processes on the production line that are delivering quality so they can then control and adjust them to meet quality and yield goals.
Increasingly, manufacturers are turning to solutions based on manufacturing intelligence. This refers to applications and technology, including systems and software, that power on-demand, real-time quality testing and monitoring to help manufacturers capture and act upon detailed information throughout the manufacturing process. Its application enables manufacturers to proactively address the quality bottlenecks on their lines so that they can remain competitive.
Without the right data, there is no intelligence
The first step in gathering manufacturing intelligence is recording the data from the manufacturing line and processes. All too often, the process- and product-monitoring systems that inspect quality along the line do not feed much, or any, data into a centralized database. This means that critical data is lost, leading to low or no intelligence. Fortunately, most plants already have the IT infrastructure in place to link these test systems to a common database. The data collected can include serial number, model number, station name, time and date stamps, pass-fail results, key parameters and measurements, and, ideally, the complete process signature for each operation.
Identify the top issues
Raw data is important but doesn’t provide the information required to make decisions and improvements. It actually can be overwhelming to have hundreds or thousands of individual records. It is amazing how many quality managers need to spend hours of their time using custom, manual methods to produce reports. The use of analytics software can automate much of this to make sense of all the data.
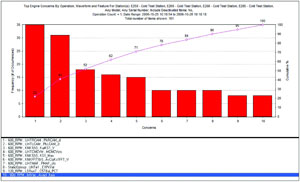
The Pareto principle is well known and applied in manufacturing. In a Pareto chart, the problems are organized from left to right in order of importance or occurrence. The old 80/20 rule is usually true of most processes, meaning 20 per cent of the effort can fix 80 per cent of the issues. A Pareto chart helps a manufacturer rapidly understand this. When applied to managing quality, it helps quality practitioners focus their attention on the issues that will have the greatest return.
The Pareto chart, as shown in Figure 1, tells the quality manager the best place to start and enables him or her to monitor the progress of changes. Further manufacturing intelligence is required to see what caused the key issues before any fixes can be determined.

Identifying the root cause of a problem
The next very important step is tracking down the cause of higher-than-desired failure rates on a production line, which is often very difficult to do, especially without the right information. The following real-world example illustrates how data collected from the manufacturing floor can be used to identify the root cause of a problem.
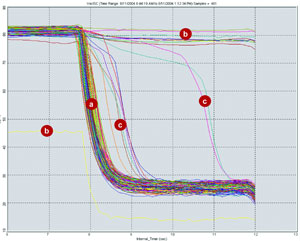
A quality engineer in an automotive powertrain plant uncovered a higher-than-normal failure rate of electronic throttle bodies at a cold-test station. This failure rate of 1.27 per cent affected 180 engines per month. Using manufacturing intelligence software to create a picture of the process signatures from the test data on all of the throttles, the engineer was able to see which parts passed, which parts failed, and the shape of the normal failures with anomalies (See Figure 2). These anomalies in the signatures were within the overall pass-fail limits set for the process, but they clearly represented the parts causing issues later at the engine cold-test station. A drill down on the apparent anomalies provided the serial numbers of parts that had passed the first test and failed the final cold test.

The engineer then conducted further analysis to identify the source of the problems. Seventy-seven per cent were due to stuck or sluggish throttles that the current test stand algorithm couldn’t catch, and 23 per cent were due to upstream process failures that had not been identified until this point. This intelligence was then applied to the production floor to prevent the reoccurrence of these issues. To address the majority of the issues, the force was increased in the operation involving the return spring on the valve. For the balance, the test algorithms and limits on upstream test stations were adjusted accordingly to reduce the number of false rejects.
The result was that the failure rate was reduced to 0.07 per cent, providing an additional monthly yield of 170 engines. The revenue increase involved in fixing this issue was more than $1 million per month. In addition to the cost savings, worker productivity was increased as the engineer could then focus on other issues with similarly strong returns for his or her time.
Looking at the limits
False failures and failures downstream in the production process are other common quality and production bottlenecks that can be caused by incorrect limit setting on process monitoring and test systems on the line. Over time, as the manufacturing process stabilizes, adjustments to limits can be made to catch previously unknown problems or to increase production without affecting quality levels.
Limits are set by engineering and rarely reviewed, mainly because of the uncertainty and downtime associated with fiddling around with limits. However, limit changes can be fully tested using historical part data before being implemented in live production. Manufacturers can then learn the effect on both yield and quality if limits are tightened or opened.
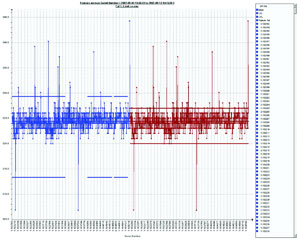
Figure 3 shows a set of signatures for a process, analysed to show a tightening of limits to catch more subtle issues that may have an impact downstream. The red and blue signatures represent the actual data from the production line, with the horizontal line outlining the limits. The signatures in red have adjusted limits, and the software calculates how many more parts would fail if these new limits were applied.

For example, a fuel-rail leak was detected at a vehicle plant, which slowed production and caused a quarantine situation of thousands of vehicles. All the test data were analysed, and it was discovered that all failures were marginal passes, which meant they had just barely passed the quality tests. In this case, the test limits being used on the test stand were those originally supplied by the part designer and had not been monitored after production startup.
The quality manager used one week’s worth of manufacturing test data to determine the impact of applying more scientific, statistic-based limits. It was determined that tightening the test limits would have caught the faulty fuel rails with a very minor impact on throughput. Two months’ worth of part data were retested, applying the new limits to identify other suspect parts. Three additional suspect parts were found and their serial numbers forwarded to the assembly plant. Production resumed at full speed since confidence in the parts was restored. Not only was this urgent bottleneck addressed, a potential recall situation by customers was averted.
Forward-thinking manufacturers who appreciate the impact to their bottom lines have already begun to apply manufacturing intelligence to end the mystery of how quality bottlenecks happen.
The good news is that most manufacturers have the beginnings of manufacturing intelligence in their plants. Test and monitoring systems can be the medium through which it all starts. Save and store the data they collect; don’t let it go to waste. Manufacturing intelligence software will then bring it to life and provide the analysis tools that will let a quality manager identify the top issues to address, and then drill down as far as needed to fix them.
Nathan Sheaff is the founder and chief technology officer of Sciemetric Instruments Inc., based in Ottawa. He founded the company in 1981, the beginning of his pioneering work in the development of signature analysis technology to detect defects in manufacturing and assembly operations. Sheaff is an electrical engineering graduate of the University of Waterloo.