Power to the process engineer
December 6, 2019
By Edwin van Dijk
Practical use of self-service data analytics makes process engineers more effective at improving operational performance
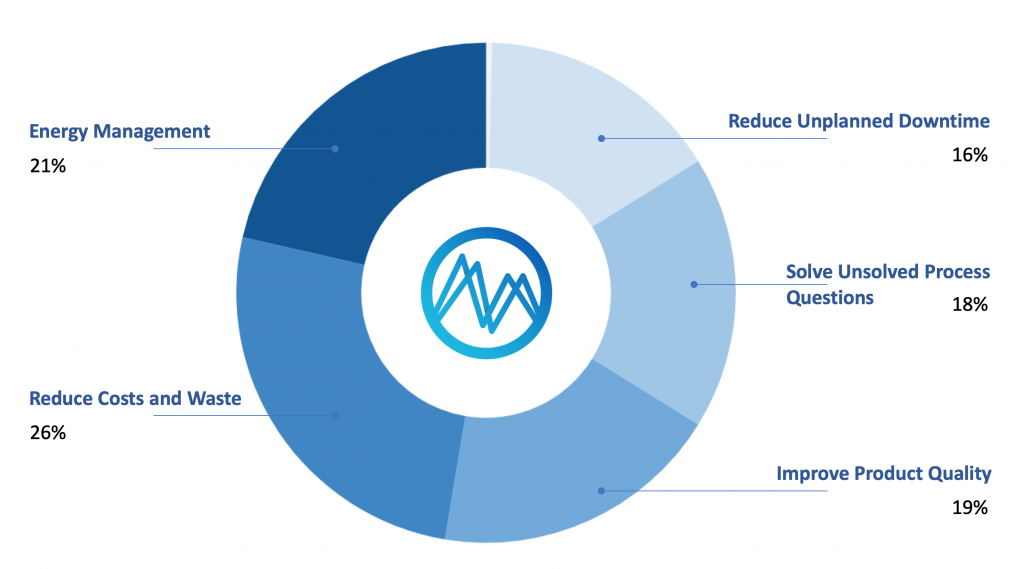 Figure 1. Most important objective of process engineers for improving their production process
 Process engineers are responsible for the design, implementation, control and optimization of industrial processes.
They are typically involved in the analysis, upgrading, modification and optimization of equipment and the production processes. If the production process is stagnating or under-performing they need to figure out why, but also in the shortest time possible for avoiding production losses, maintaining product quality and avoiding high maintenance and repair costs.
Process engineers are expected to monitor and evaluate all processes and equipment, and develop more streamlined, economical processes. In a recent survey performed by CFE Media, engineers indicated that when analyzing manufacturing data their main objective is to reduce costs and waste (26 per cent of the participants), directly followed by reducing energy consumption (21 per cent). But how to effectively use decades of data without the need of data scientists?
Common data analytics challenges
Although engineers are used to analyzing data for all kinds of operational issues, they still run into various challenges:
-
- Unintegrated, messy and disparate data sources, including historians, operator logs, shared drives, intranets, document control DBs, DCS alarm historians, SAP, OEE DBs, incident report DBs, PHAs, MS Access DBs, LIMS systems and written round sheets.
- Existing software is unstable when looking at large volume of sensor-generated time-series data (crashes, delays and errors).
- Over-reliance on spreadsheets for aggregating critical plant information. Spreadsheets are un-secure and prone to errors, typos and corruption.
- Wrangling manufacturing data sets into generic tooling is a manual and painful process. It is hard to find the signal through the noise of maintenances, data losses, calibrations, instrument failures and other sources of data quality issues.
- Large gap between analysis and automating findings into actionable real-time monitoring or alerting.
- Plant data is difficult. Deeply covariant time series measurements with lag-times between cause and effect. This makes statistical interpretation of the data almost impossible for the non-process expert.
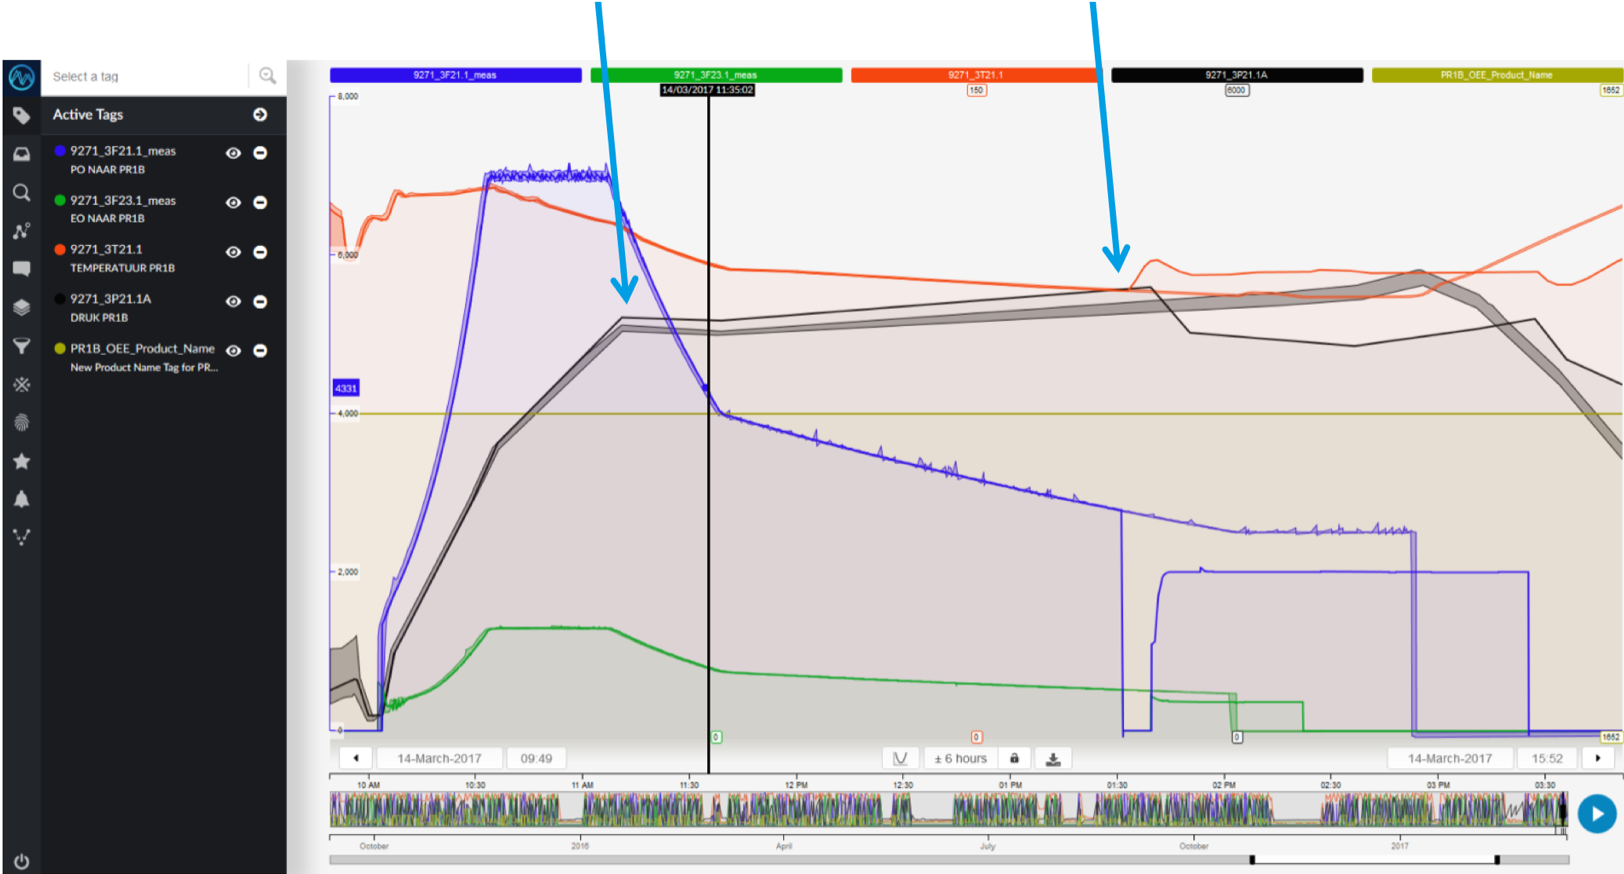
Figure 2. With self-service data analytics software, Covestro was able to identify the problem and eliminate a production loss off 125 tons.
Leveraging manufacturing data
Process manufacturing companies have been gathering sensor-generated time-series data for many years in their historian of choice, so massive amounts of process data is available for analysis. However, turning this data into knowledge is a different story. Ideally, analyzing big data should be simple, easy and fast and provide knowledge with context.
Covestro, a supplier of high-tech polymer materials, was facing two main issues. First of all, big-data analytics was done in MS Excel – a slow process, obstructing engineers to use all data. Also, handling large volumes of data, the team needed a supercomputer to get work done. Secondly, with complex problems Covestro turns to its analytics experts for data modeling. This not only demands a lot of investigation and modeling time, but also leads to potential knowledge loss at the plant.
To leverage their historian to the max, engineers started looking for a way to advance the use of data. In order to do so, Covestro selected a self-service industrial analytics platform, with no data modeling needed to analyze many years of production data and no Excel to analyze or monitor production performance. The platform was able to find root causes of problems and show them through graphical visualization of data.
The use of this new way of analyzing their manufacturing data has led to better control and even reduction of energy consumption at their site. In the past, the engineers would use Excel files to manually compare energy consumption data from one year to the other. The self-service analytics platform helps them bring a certain year to display. By adding the following years of energy consumption as layers, they are able to easily compare large periods of time. No Excel needed anymore.
In another situation, process engineers experienced unwanted production stops. By tagging good badges as “fingerprints,” or operating zones, in their analytics software, Covestro was soon able to identify deviations in its production runs – leading them to a problem in the control system. Finding the root cause with “fingerprints” helped them eliminate a potential production loss of 125 tons.
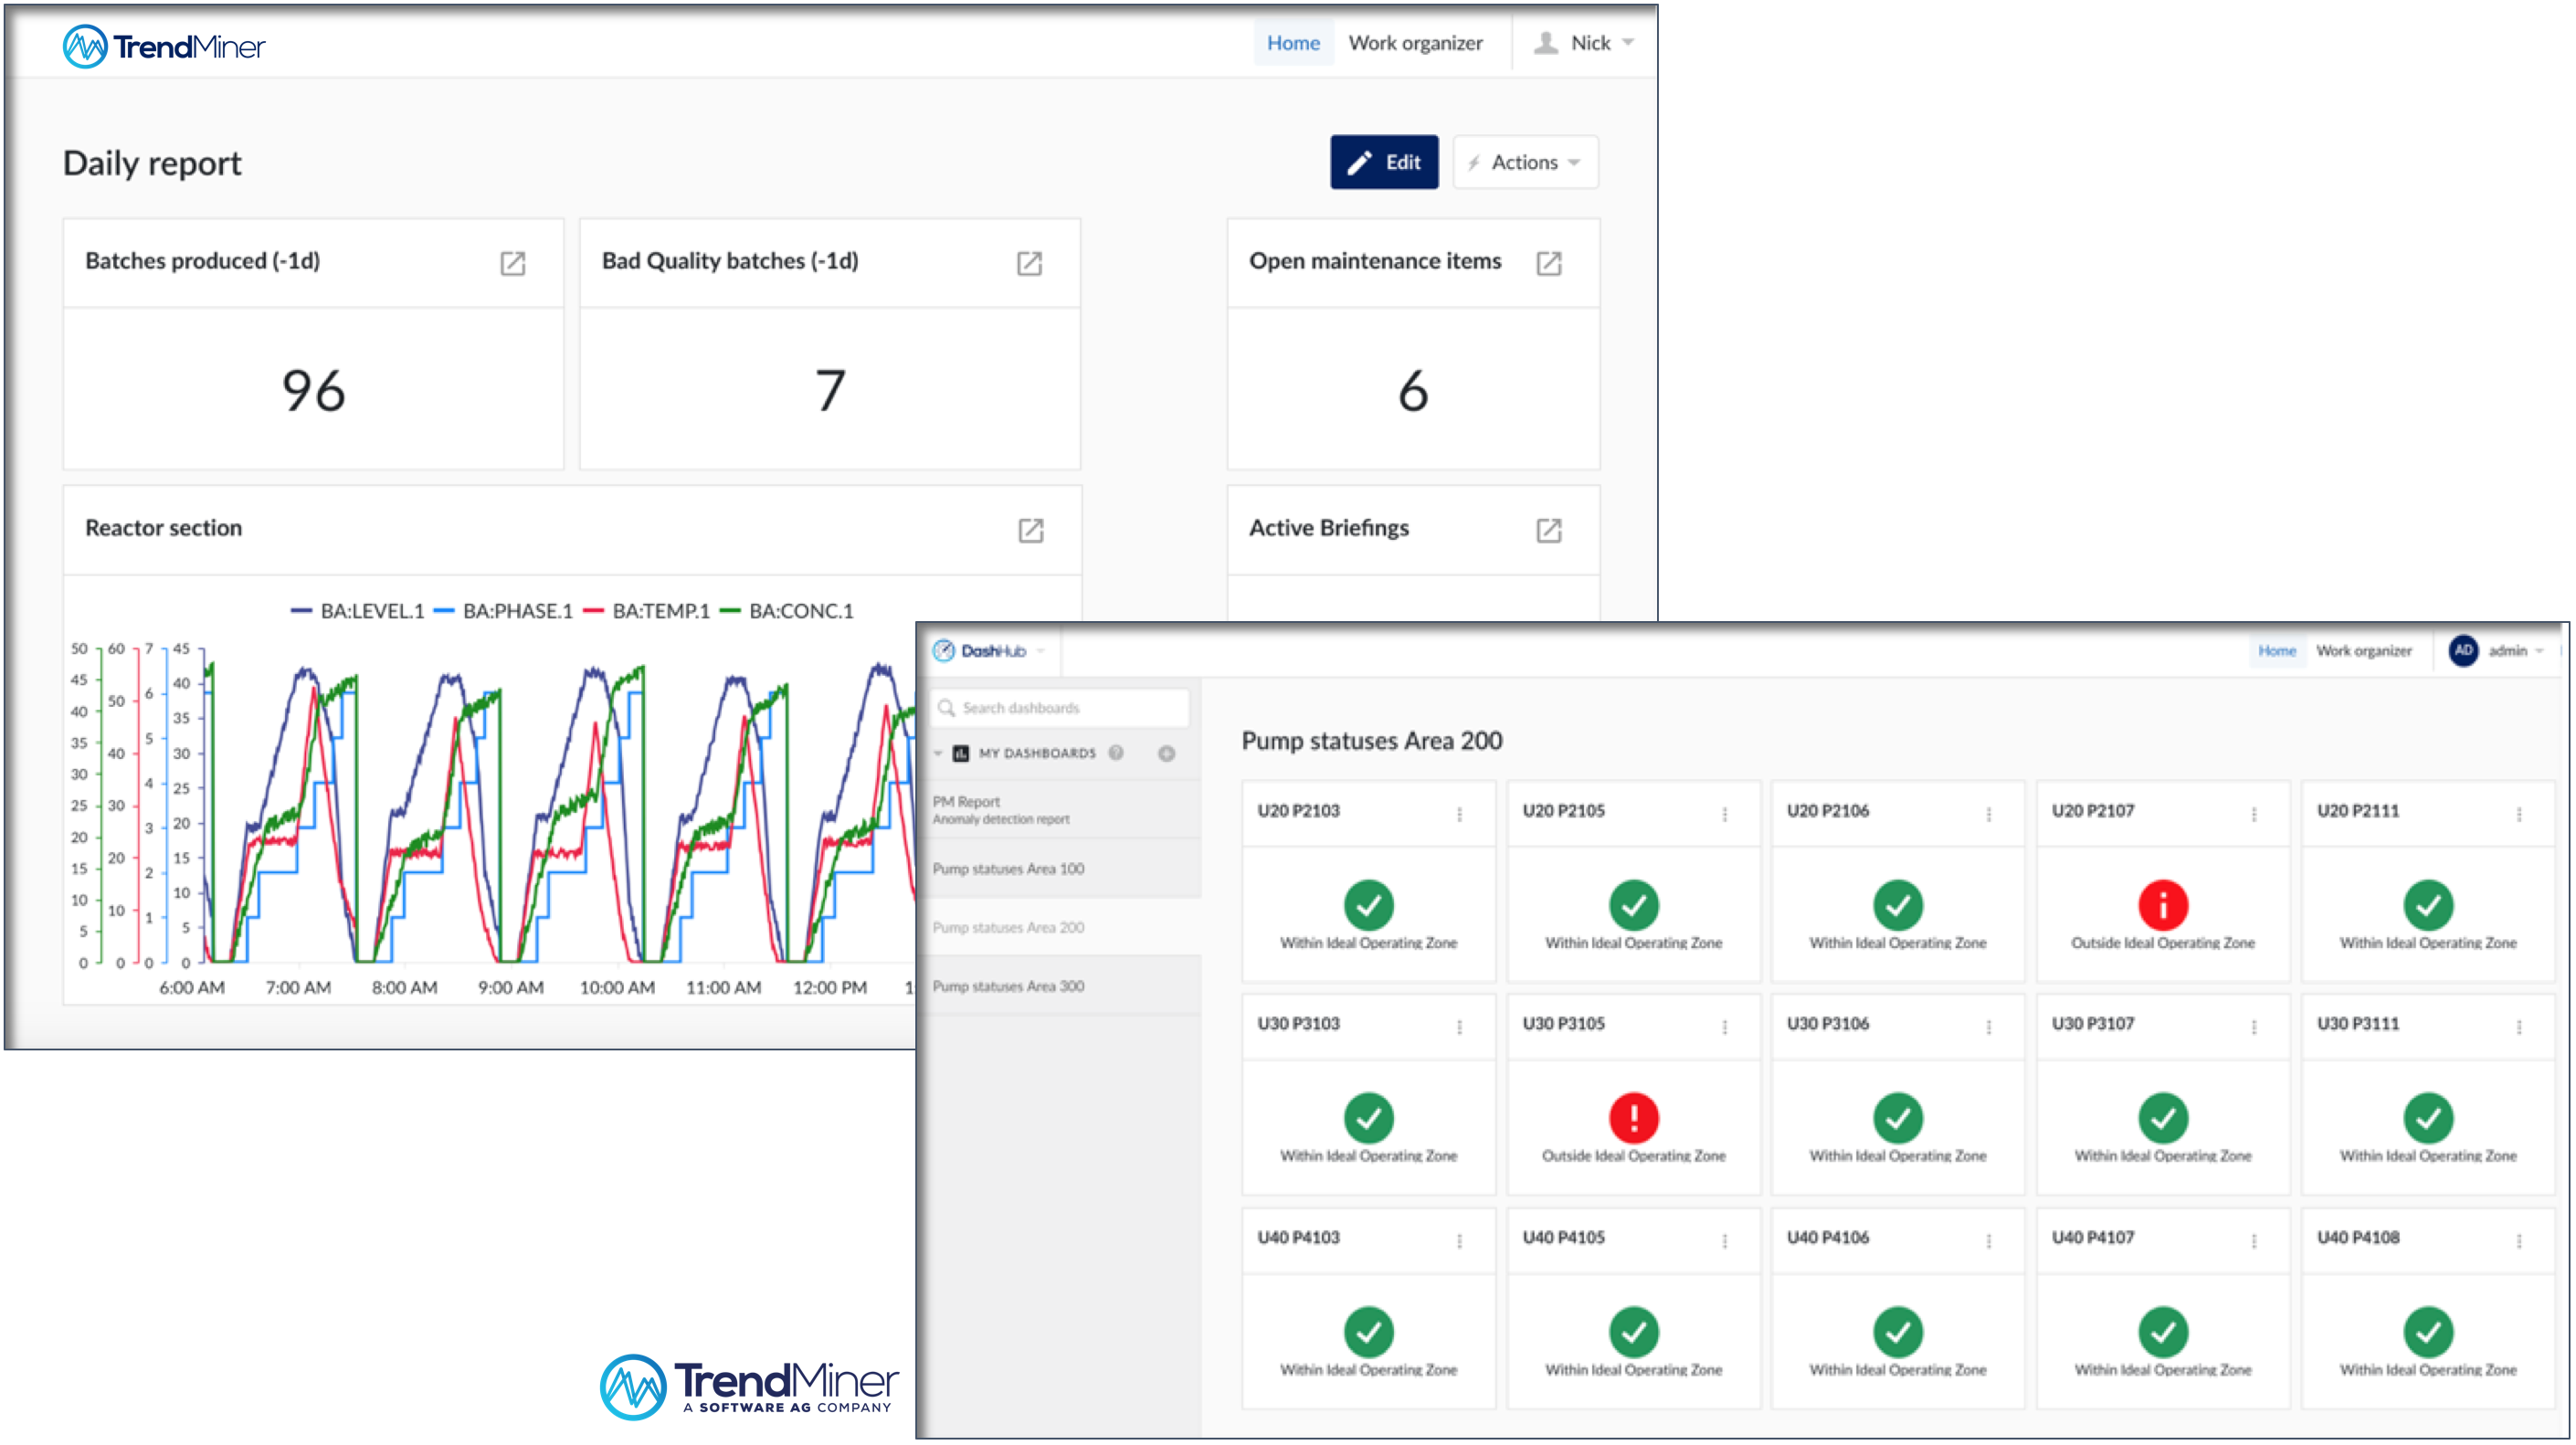
Figure 3. Engineers can use self-service advanced analytics to create a Production Cockpit for each stakeholder in the organization.
Meeting organizational goals
Whether it is improving product quality or reducing waste, process engineers are looking for ways to contribute to the organizational KPIs. To make them as effective in that goal as possible they need to have adequate tools and leverage the data available.
Ashland is a provider of specialty chemical solutions that has recently shifted its focus from the construction market to the pharmaceutical market. In order to succeed in this transformation and leverage the benefits of digital transformation, Ashland’s engineers identified four key focus points regarding people, process and tooling:
- Further automate the plant in order to allocate more resources to pharmaceutical products
- Use proven methodologies such as Six Sigma and the DMAIC cycle
- Make capital available for improvement projects
- Equip the engineers with the right tools, such as advanced analytics
A steady production process is required to maintain a steady product quality. Therefore, the engineers need to familiarize themselves with the equipment, and be very aware of the influence the process has on the end product. As Ashland works for pharmaceutical customers, they need to be compliant to GMP standards. One common factor in all those challenges is the data they use to resolve them. This raised an important question: how do they use and transform large quantities of data into something that product engineers can actually use? And even develop new ideas?
Self-service industrial analytics proved to be the solution that helped Ashland to analyze and understand their data better and leverage it to profit from digitalization. The monitoring capabilities enable process and production engineers to raise certain “red flags” in time, and prevent incidents from happening in the future. Based on patterns, they are notified when an incident occurs.
By implementing the self-service industrial analytics platform, Ashland was able to solve previously unsolvable production issues and enhance quality. More importantly, they were able to increase their on-target production of GMP products from 70 per cent to over 95 per cent within the first year of using self-service advanced analytics.
The monitoring capabilities enable process and production engineers to raise certain “red flags” in time, and prevent incidents from happening in the future.
Expanding to the entire organization
Having the data at their fingertips in order to quickly analyze it helps engineers to continuously improve operational performance and contribute to organizational goals. After analyzing the data and finding root causes for performance issues, engineers can also easily find best performance and use that to create best operating zones of equipment. These can be used for early warnings and notifications, enabling to control business outcomes in areas such as energy management, waste reduction, and increasing uptime.
The work of the engineers can be used for real-time monitoring. Dashboards can be created for each level of the company, based on live production data and early warnings, creating a production cockpit for each operational stakeholder in the organization.
_____
Edwin van Dijk is VP marketing at TrendMiner.
This article originally appeared in the November/December 2019 issue of Manufacturing AUTOMATION.
Advertisement
- GM, Korea’s LG Chem in venture to build factory in Ohio
- WAGO releases double-deck push-button terminal block