Connecting risk and reliability
June 16, 2015
By Douglas Nix Compliance Insight Consulting

Jun. 12, 2015 – One of the big challenges that control systems designers and safety engineers face is the relationship between machinery risk and control system reliability. Machinery safety standards began introducing the idea of control reliability, more often called functional safety, back in the early 1990s. The earliest standards used a prescriptive approach, introducing circuit architectures with names like single channel, single-channel monitored, and control reliable. In the mid-1990s, CEN in the European Union brought in some similar, but slightly different, architectures which were called out as “Category B” and “Categories 1 through 4.” Unfortunately, while this was an important advancement, it also introduced a lot of confusion for designers.
Since then, functional safety standards have advanced considerably. The latest documents now provide a more flexible, probabilistic approach to determining the control system design requirements based on risk. The old category system is still in use, and the architectures of those categories remain unchanged, if you choose to use the current edition of ISO 13849. There are additional choices available to control systems designers in terms of the component selections and diagnostics that they can use to boost the reliability of designs to meet the requirements. If ISO 13849 doesn’t adequately model your control system, a designer could also choose to use IEC 62061 or IEC 61508, which provide a much greater degree of freedom in design, with a tradeoff in more complex analytical techniques.
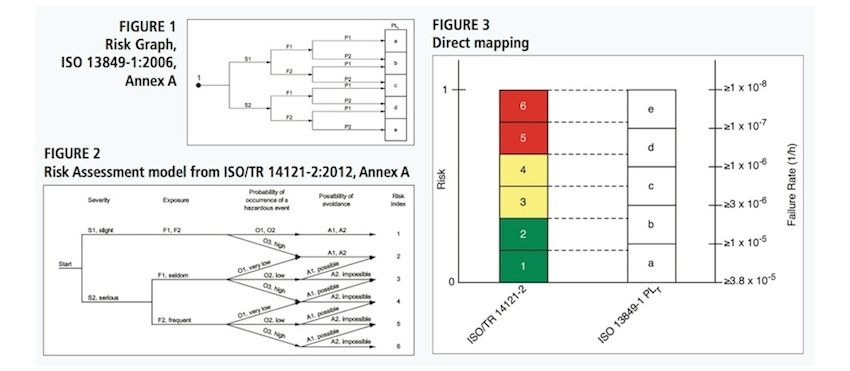
Despite all the advancements, one key problem remains — how to match the reliability requirement with the risk? Both ISO 13849 and IEC 62061 offer suggestions about how this might be done. See Figure 1. Annex A of both standards provide decision trees or matrices that can be used to select the Performance Level (PL), or the Safety Integrity Level (SIL), based on risk. The methods given in the Annexes work, and there is no major reason not to use them, except one: they require you to effectively reassess the risk for each hazard using the scales provided, but they provide an output in terms of reliability, rather than risk. If a method existed for mapping directly from the risk output to the reliability requirement, time could be saved and some confusion eliminated.
ISO 12100, Safety of machinery — General principles for design — Risk assessment and risk reduction, requires that risk assessments consider four key variables: potential Severity of Injury, Frequency or Duration of Access, Probability of the Hazardous Event, and Probability of Avoiding or Limiting the Harm. ISO/TR 14121-2 gives some examples of decision trees, Figure 2, and matrices that meet this requirement. As long as your risk scoring tool incorporates these variables, then you can map the output of your risk assessment tool to the functional safety requirements.
How can a designer map from a 1-6 scale like that in Figure 2 to a reliability scale from a-e like that in Figure 1? At least two approaches can be considered:
1) Factor mapping, and
2) Direct mapping.
In the first method, each variable iMan the risk-scoring tool is compared against the counterpart variable in the reliability decision tree (Table 1).

As you can see from Table 1, a problem exists. There is no variable for Probability of the Hazardous Event given in Figure 1, so no factor mapping is possible, unless it can be assumed that the O factor is always taken to be a certainty, or a probability of 1. Even this doesn’t provide a direct match, since the highest probability of occurrence in Figure 2 is O3, and even that does not describe a certainty of injury.
If a designer develops their own scoring tool using all the required variables, it would be possible to set the O factor to 1 when dealing with direct factor mapping, but this serves to illustrate the difficulty in using this approach.
Direct mapping gives the designer the ability to ignore the input variable details, and simply map the output scale from the risk model directly to the input scale for the reliability model, as seen in Figure 3. In this approach, the maximum risk is assumed to match the maximum reliability, and the minimum risk is assumed to match the minimum reliability. The intermediate values are then mapped across to each other. Note that this will only work if the two scales are linear. If one is logarithmic this method cannot work.
Using Figure 3, you can see that a low level of risk, 1 or 2, maps to PLa or PLb, relatively low reliability levels, and likewise, the higher levels of risk also map to higher levels of reliability.
None of the current machinery safety standards prescribe a specific risk-scoring tool. At most, they will prescribe the minimum variables that must be considered, leaving the selection of a decision tree, matrix or probabilistic calculation method to the risk assessor. On the other hand, the functional safety standards all prescribe certain functional safety bands, whether PLa-e or SIL1-SIL3. These standards don’t prescribe the approach taken to determine the initial reliability requirement, only that it must be based on risk.
Control systems designers and safety engineers must find ways to map their preferred risk-scoring tool to the functional safety input requirements. Whether you choose to use one of the example methods shown in the functional safety standards or develop your own mapping, care must be taken to ensure that your system does not underspecify the reliability requirements.
Douglas Nix, C.E.T., SM-IEEE, is managing director at Compliance Insight Consulting. He has more than 25 years of engineering technology expertise, though he has focused on risk assessment and machinery safety since 1996.
This column originally appeared in the May 2015 issue of Manufacturing AUTOMATION.