Case study: deploying real-time data collection for measuring OEE as a productivity tool in manufacturing
March 11, 2016
By FreePoint Technologies
Mar. 11, 2016 – Provided by FreePoint Technologies, the following text provides and outlines a summary of FreePoint’s recent research project, in collaboration with Fanshawe College and funding assistance from OCE and NSERC.
Project number: 22501 “Deploying real-time data collection for measuring overall equipment efficiency (OEE) as a productivity tool in manufacturing”
Project purpose:
To establish that measuring value adding activities empirically, establishing key performance indicators (KPIs) that are meaningful and relevant to assemblers and operators, and sharing those KPIs with the assemblers and operators in real-time will have a significant and positive effect on productivity.
Background:
FreePoint Technologies was founded in 2013 by Randy Hess and Paul Hogendoorn — two seasoned entrepreneurs familiar with the needs and challenges facing manufacturing, and equally familiar with information technology available today.
In 2013, FreePoint acquired a root technology from St. Clair Technologies, a company that Hess co-owns and is a director of, and then further developed that technology into a product that had broad industry application. A provisional patent was applied for in 2013 and is currently pending.
In 2013 and 2014, FreePoint deployed the resultant technology in several “early adopting” customers in order to prove out the basic value proposition — that an engaged workforce could be a more productive and happier work force.
Having established “anecdotal proof” with a small user group, FreePoint developed a cloud based SaaS offering, filed a second patent application, and concluded that an empirical study was needed to help the market accept FreePoint’s paradigm challenging value proposition.
Test site selection:
FreePoint looked at a wide number of local manufacturers that had an interest in the type of project that we were proposing. We concluded that we needed two different types of manufacturing companies involved: a steady state manufacturing operation, and a job shop manufacturing operation.
Job shop manufacturer: ‘Company A’ is a 40-year-old London, Ont., area company that employs 120 people. It is primarily a tool and die and solutions manufacturer for automotive customers. It has 20 machines that are critical to its manufacturing processes. Its business order book was consistently full so any productivity gains would result in direct bottom line gains. We selected six machines that represented a good mix of regularly operated machines for the test.
Steady state manufacturer: ‘Company B’ is a 25-year-old company that employs 60 people. It produces engineered textiles for various industries. It has been running at capacity, producing product 24 hours a day, five days a week, over three shifts. Approximately 40 machines are involved in the production, 30 of which are very similar in function and operation. We selected one group of seven machines — one row.
Establishing baselines and control conditions:
Company B had a lot of historic production information so we did not have to establish a “control” machine. Its key performance metric was the weight of the product shipped each day. Each roll of product has a specific weight and the production of each roll required a specific time on the machine. They know that their average “uptime” of the machines overall was 82 per cent, and that this number has been consistent for years.
Company A did not have similar production information that could be tied back to machine run-time, and the jobs that need to be performed each day vary greatly. One of the six machines selected for the test would be “the control machine”; we would use this machine to give us a comparative baseline for the other five machines. Since the only thing we ultimately wanted to deduce was the effect of giving the operator meaningful performance feedback in real time, the control machine was equipped with a small computer and screen that only he could see. One operator, on one machine, would be working with real-time relevant feedback, and five wouldn’t be.
Company A would clearly provide the biggest challenge. It would require a far longer recording period to establish a reliable pre-deployment baseline. Fortunately, we have had several job shop companies to choose from where we had been collecting basic baseline data.
Equipment and software involved:
FreePoint installed its FPT 4i remote monitoring unit on each machine in the study at both companies. The FPT 4i is a simple “black box” that has four digital inputs and communicates wirelessly with an FPT MS1 master communication device. The MS1 is connected to a simple PC, which runs a small data aggregation program called CellMonitor.
The entire installation was non-invasive, meaning that none of the machines, the controls, or the programs needed to be modified in anyway. FreePoint uses its patent-pending technology to connect to the machine simply. Similarly, by using wireless communications to the data aggregator, the installations were performed very quickly and non-disruptively.
Summary of equipment for first stage:
FPT 4i remote units mounted on machines in the test, using FreePoint’s non-invasive connections to the machine, and wireless communications to the data aggregator.
FPT MS1 master communication unit to communicate wirelessly with each FPT 4i unit, and transfer the reported information to a PC through USB.
CellMonitor is FreePoint’s proprietary software that manages the wireless network and sorts and stores all the events reported by the FPT 4i remote units. The information is all stored in CSV files sorted by machine, and date and time stamped and stored in chronological order.
FP Secure is FreePoint’s proprietary software that then pushes the data on the PC to a remote server (our ‘ShiftWorx’ platform) in the cloud. This stage was not absolutely necessary, but having access to all the data remotely and on one server facilitated our analysis. Plus, it added one more level of data redundancy.
Data redundancy:
The FreePoint system provides several levels of redundancy. The FPT 4i boxes each store their own timer and counter functions. If communication is lost for several seconds, or even minutes or hours, the data aggregator is instantly updated with timer and counter information as soon as the connection is restored. (The time stamped information is lost, but the accumulated timers and counters are not). If the data aggregator (CellMonitor) loses connection with the remote server (ShiftWorx), even for multiple days, all the information is filled in and synchronized when the connection is restored.
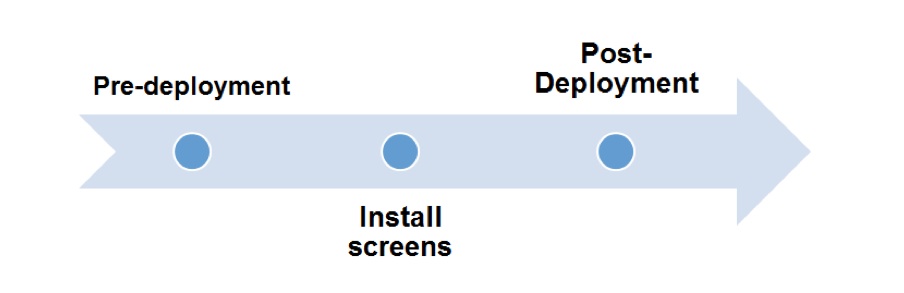
Our process:
Our process was simple. At each customer, we would collect data for a sufficient period of time, analyze the data, determine basic KPIs and then build rudimentry display templates to display them. At a selected point, LCD screens would be installed on the plant floor where the operators could see them, and we would then continue to monitor the machines exactly the same way we did before the LCD screens were deployed.
As a side note, the process we followed lines up well with FreePoint’s overall product marketing approach – “measure, analyze, share.” For the study, we did it as three distinct steps over a long period of time. What we encourage manufacturers to do, and what we started doing at the time the screens were deployed, is closing this loop on the plant floor in real-time, every day.
The screen here is an example of the feedback we gave the operators. Each horizontal bar represents a 24 hour period of time for a particular machine. The right most side is the current time and the left most is 24 hours ago. The blue periods are the periods of time where “value adding activities” were occurring on the machine. The white represents periods of time where no value adding activity was occurring. In the case of an EDM machine, value adding activity was determined to be any time the electrode wire was feeding. For the CNC machines, it is any time the spindle is under load. For the water jet, it would be any time it is actually cutting.
The boxes on the right are numeric KPI (key performance indicators) that can be easily changed and modified to suit the preference of the people involved. The goal was to give them indications of performance that is meaningful to them.
(Many of the features described in general herein are the protected proprietary property of FreePoint Technologies.)
After deployment of the screens, we collected data to compare the results. We also engaged with the operators and supervisors and modified the KPI boxes to suit. We never changed our “blue line” approach, as very early on we noticed a strong focus simply on “keeping the bar blue.” The more the bar was blue, the better the results would be.
The results:
Company A (the job shop) achieved outstanding results, increasing their “spindle under load time” (which we refer to as “value adding activity time”) by 32 per cent, gaining a total of six additional hours and 24 minutes of productivity each day for the five machines we studied.
Company B (the steady state manufacturer) improved from 81.8 per cent average uptime to 86 per cent average uptime – a very significant improvement as well. Based on 7,200 production minutes available in a standard five-day week, it results in an extra 300 minutes of winding time per week, per machine, which is roughly 2/3 of a complete shift.
Charts and graphs for the two test companies are attached here.
Our conclusion:
Our conclusion is that by engaging the “value-adding people” (the people that run the machines and add value to the product through their direct activities) with meaningful and relevant productivity indicators in real-time will, and does, result in sustained productivity improvement.
Many companies measure their machine utilization and have plenty of information for management purposes. FreePoint’s position was that there is an opportunity to improve productivity by better engaging the worker with information more meaningful to them. It’s not about more information — it’s about more meaningful information to more of the people, in real-time.
This case study was supplied by FreePoint Technologies.
Advertisement
- Industry players collaborate on Time Sensitive Networking testbed with IIC
- Ontario converts Nanticoke coal plant to solar farm